スマートリテール人流ヒートマップ — デプロイガイド

プリセット

AI Camera Direct

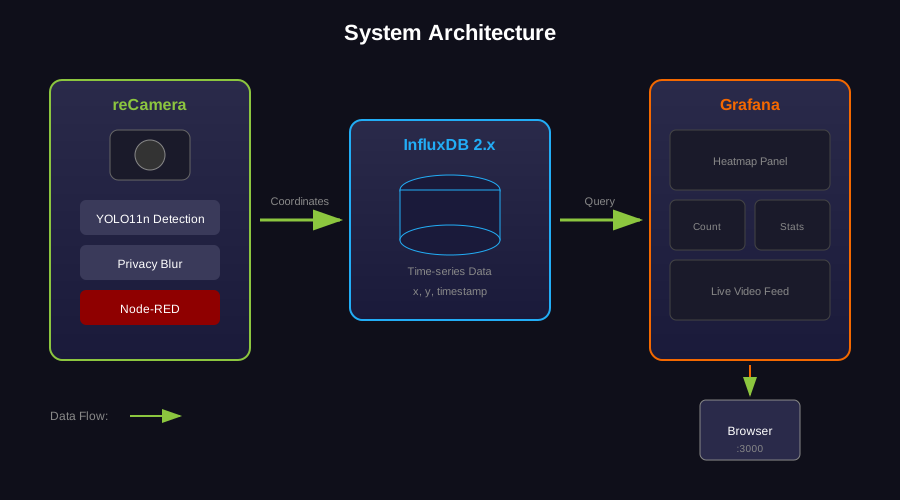
reCamera detects people on the camera and publishes results over MQTT; a computer or reComputer R1100 runs the dashboard and keeps the history.

  • Devices: reCamera; a computer or reComputer R1100 for the dashboard.
  • Software: Docker on the dashboard machine, at least 2 GB free disk.
  • Network: all devices on the same network.
1

Start Data Dashboard

Start the MQTT broker, database, Grafana dashboard and video gateway. Every camera publishes here. Deployment discovers ONVIF cameras on the same subnet; if the backend and cameras are on different subnets, enter the camera addresses in the deploy form.

デプロイ方法
配線

Wiring

Make sure Docker Desktop is running.

入力が必要な項目(SenseCraft Solution アプリで入力)
  • Camera RTSP URLs (optional)

    Only needed for cameras ONVIF discovery cannot see — one per entry as id=url, comma separated

トラブルシューティング
SymptomFix
Port conflict errorFree ports 8086, 3000, 8080 and 1883
Docker not availableStart Docker Desktop
Not enough diskKeep at least 2 GB free
2

Connect Camera to Dashboard

Install the retail analytics app on the reCamera and set the broker it publishes to. The app reports dwell state (browsing / engaged / needs assistance) and entry/exit counts.

配線
  1. Over USB the IP is 192.168.42.1; over Ethernet or WiFi, find the IP in your router admin page
  2. Enter the reCamera IP, the MQTT server IP (the machine from Step 1), an installation name and a camera ID
  3. Cameras in one store share an installation name and use different camera IDs; the dashboard uses these to tell devices apart

This step disables Node-RED autostart; the two cannot run at the same time.

トラブルシューティング
SymptomFix
Cannot connectUSB: use 192.168.42.1; network: check router for IP
No data showingMake sure Step 1 completed and camera and server are on the same network
Fails to start with a device_init assertionReboot the camera

3

Map Heatmap to Floor Plan (Optional)

The heatmap shows the camera's perspective by default. Use the built-in calibration tool to show it on your store's floor plan.

How to Do It

  1. Open http://<server-ip>:8080 in your browser
  2. Click the gear icon (top-right corner) to open calibration settings
  3. Pick the camera to calibrate ("All cameras" sets the default for any camera without its own calibration)
  4. Upload a camera screenshot (left side) and your floor plan image (right side)
  5. Click 4 reference points on the camera view, then the same 4 spots on the floor plan; use widely spaced landmarks such as pillars, doorways or corners
  6. Click Save; calibration applies immediately

Calibrated cameras share one floor plan. The dropdown at the top-left narrows the view to a single camera.

Skip This If

You only need the camera-view heatmap.
トラブルシューティング
SymptomFix
Heatmap doesn't align wellOpen settings, click Reset, and recalibrate with different reference points
Calibration survives a browser changeExpected; calibration is stored on the server
4

Open Dashboard

Click below to open the Grafana dashboard.

トラブルシューティング
SymptomFix
Page not loadingMake sure Step 1 deployed successfully; run docker ps on the server to check services
Wrong host/portIf you deployed to a remote device, use its IP in the URL
No dataMake sure Step 2 completed and the MQTT server IP is the machine from Step 1
デプロイ後
  • Data Dashboard: http://<server-ip>:3000, login admin / admin, traffic trends
  • Live Heatmap: http://<server-ip>:8080 (calibrate via the gear icon)
  • Video gateway: http://<server-ip>:1984, discovered cameras and preview